Today’s given signal : https://t.me/calendarsignal/10246
How to interpret the Initial Jobless Claims report
The initial jobless claims reading is compared to consensus forecasts:
The market’s reaction to the initial jobless claims reading is influenced by the prevailing economic environment and its possible impact on future monetary policy by the U.S. Federal Reserve or fiscal policy by the U.S. government.
Generally, the market tends to respond positively to initial jobless claims that are significantly below expectations.
An increase or decrease of 30,000 or greater in jobless claims is considered significant. Anything less is seen as normal fluctuations.
An increase in sustained claims or high numbers signals rising unemployment and job-loss, as many individuals seek unemployment insurance.
Significant increases in these claims could imply a slowdown in job growth due to rising unemployment.
If economic data shows signs of weakness, investors may anticipate a weaker next Non-Farm Payrolls (NFP) report.
Conversely, a decline could indicate a healthier economy, and future NFP reports should indicate improved conditions.
A significant decrease in unemployment claims indicates an acceleration of job growth and a strong economy.
The report includes a four-week moving average to smooth out volatile weekly changes.
Most analysts see a four-week moving average ofmore than 400,000 claimsas signs of economic weakness.
A sustained rise in new claims for several months often foreshadows a drop in GDP growth.
An increase in the Continuing Jobless Claims negatively impacts the NFP, influencing consumer spending and deterring economic growth.
Generally speaking, a high reading is seen as negative for the labor market while a low reading is seen as positive.
More than 3 million continuing jobless claims are considered alarming.
Traders buy government bonds when workers file for unemployment insurance, anticipating an economic slowdown and pushing interest rates down.
If interest rates are lower (depending on how strong the U.S. economy is compared to other countries), the U.S. dollar may be weaker.
The U.S. dollar might not budge even if the employment situation is deteriorating in the U.S. based on the Initial Jobs Claim report (and might even strengthen) if the employment situation is worse in other countries.
Content of the Philadelphia Fed Survey
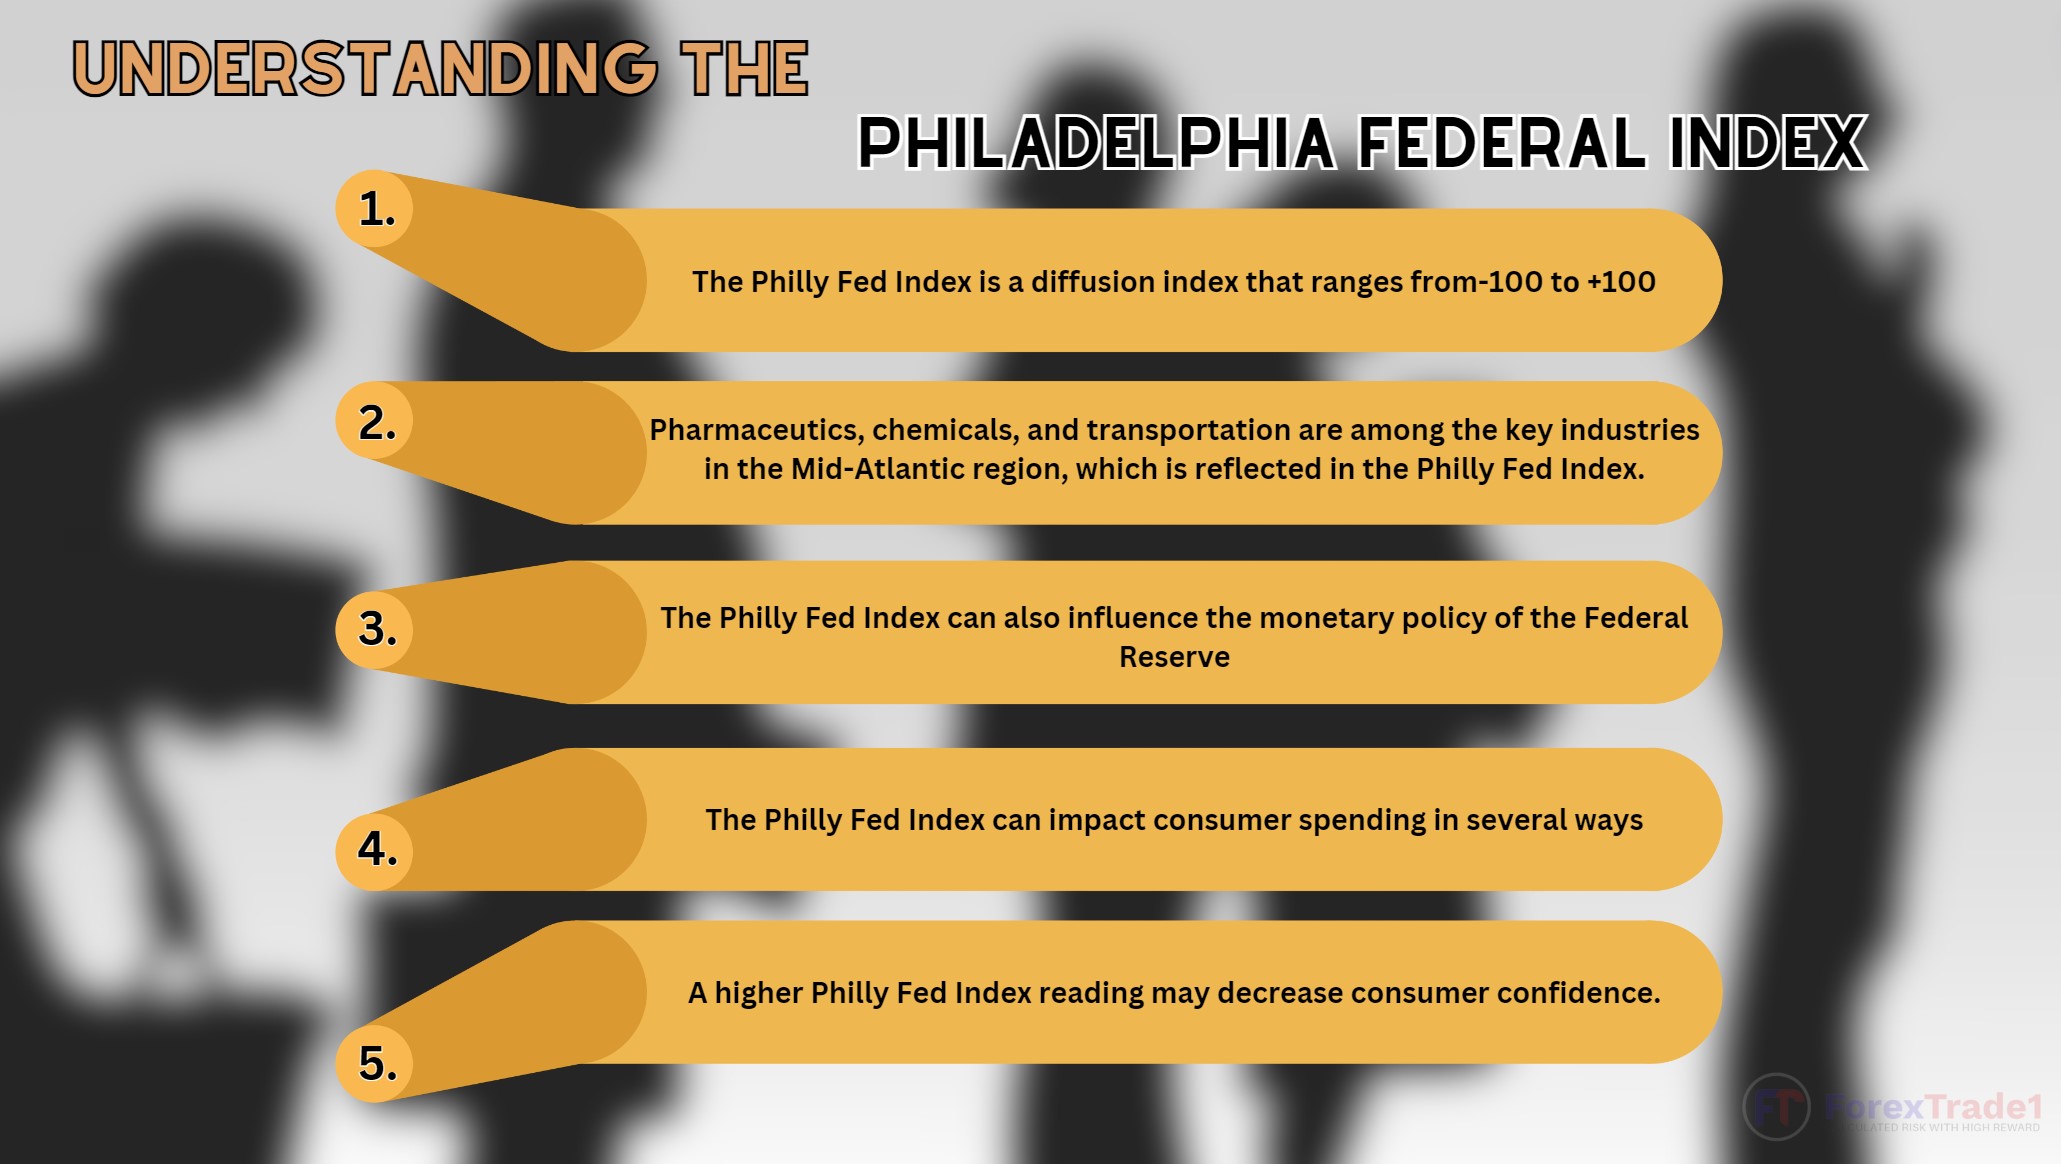
The Philadelphia Fed Survey offers a rich array of written and visual insights into the manufacturing climate in the Northeastern United States. Although the Survey only queries manufacturers in a small subset of the United States, it may be a useful indicator of economic and business activity across the nation.
As manufacturing remains integral to overall economic activity, its health serves as a barometer of the health of the entire economy. The Philadelphia Fed Survey, by highlighting problems in the region’s manufacturing sector, could anticipate economic struggles nationwide.
Despite some conflicting evidence, the publication’s influence on the capital markets is undeniable. It is regularly quoted in news publications and referenced by investment professionals and economists. A significant part of the survey’s value lies in its consistent archival data. The Survey has been conducted continuously since May 1968, and monthly historical data is readily available.
The Philadelphia Fed Survey, presented in the form of a newsletter, provides a detailed overview of the region’s manufacturing sector, indicating its growth or decline, key driving factors, and any areas of concern. The report also addresses special questions. The survey includes a chart comparing projected activity with current activity. Each report includes a table summarizing survey responses, noting the percentage of respondents who reported increases, no changes, or decreases in each indicator, like new orders and shipments. The table then provides a diffusion index for each indicator
Latest Updates
The Philadelphia Fed Manufacturing Index in the US declined to -10.5 in December 2023 from -5.9 in the prior month and far worse than market estimates of -3. This is the index’s 17th negative reading in the past 19 months. The sharp drop in the new orders index from 1.3 to -25.6 in December was notable. The shipments index rose 7 points but remained negative at -10.8. Although December’s employment index slipped into negative territory, it suggests relatively consistent employment levels overall. The employment index fell 3 points to -1.7 in December. The average workweek index remained negative but rose 6 points to -5.0. The price indexes neared their long-run averages. The prices paid index rose 10 points to 25.1 in December, while the index for current prices received dipped slightly by 1 point to 13.6. Most future activity indicators rose, suggesting more widespread expectations for overall growth over the next six months.
Previous released data results :
Where to contact us :
Website : www.forextrade1.co
Twitter : www.twitter.com/forextrade11
Telegram : telegram.me/ftrade1
Facebook : www.facebook.com/Forextrade01
Instagram : www.instagram.com/forextrade1
YouTube : www.youtube.com/ForexTrade1
Skype : forextrade01@outlook.com
Email ID : info.forextrade1@gmail.com
Discord : https://discord.gg/vEk98ZvrHP
LinkedIn : https://www.linkedin.com/company/forextrade11


